
NotiBelt
SKILLS:User Study,Prototyping,Research
Wearable Device 2015
Abstract
Eyes-free and ears-free output is an important topic recent year. Although numerous works exist to secretly provide information through haptic feedback, these devices offer limited functionality for low speed, low bandwidth, and low accuracy. We introduce NotiBelt, a haptic belt that transmits notification and information via wearing belt. A notification is made in two steps, belt vibrates for an incoming message, and creating tactile patterns for the user to touch. Users can receive the full message on fingertip by touching the tactile pattern. We discuss social implications and interaction space through study.
Prototype
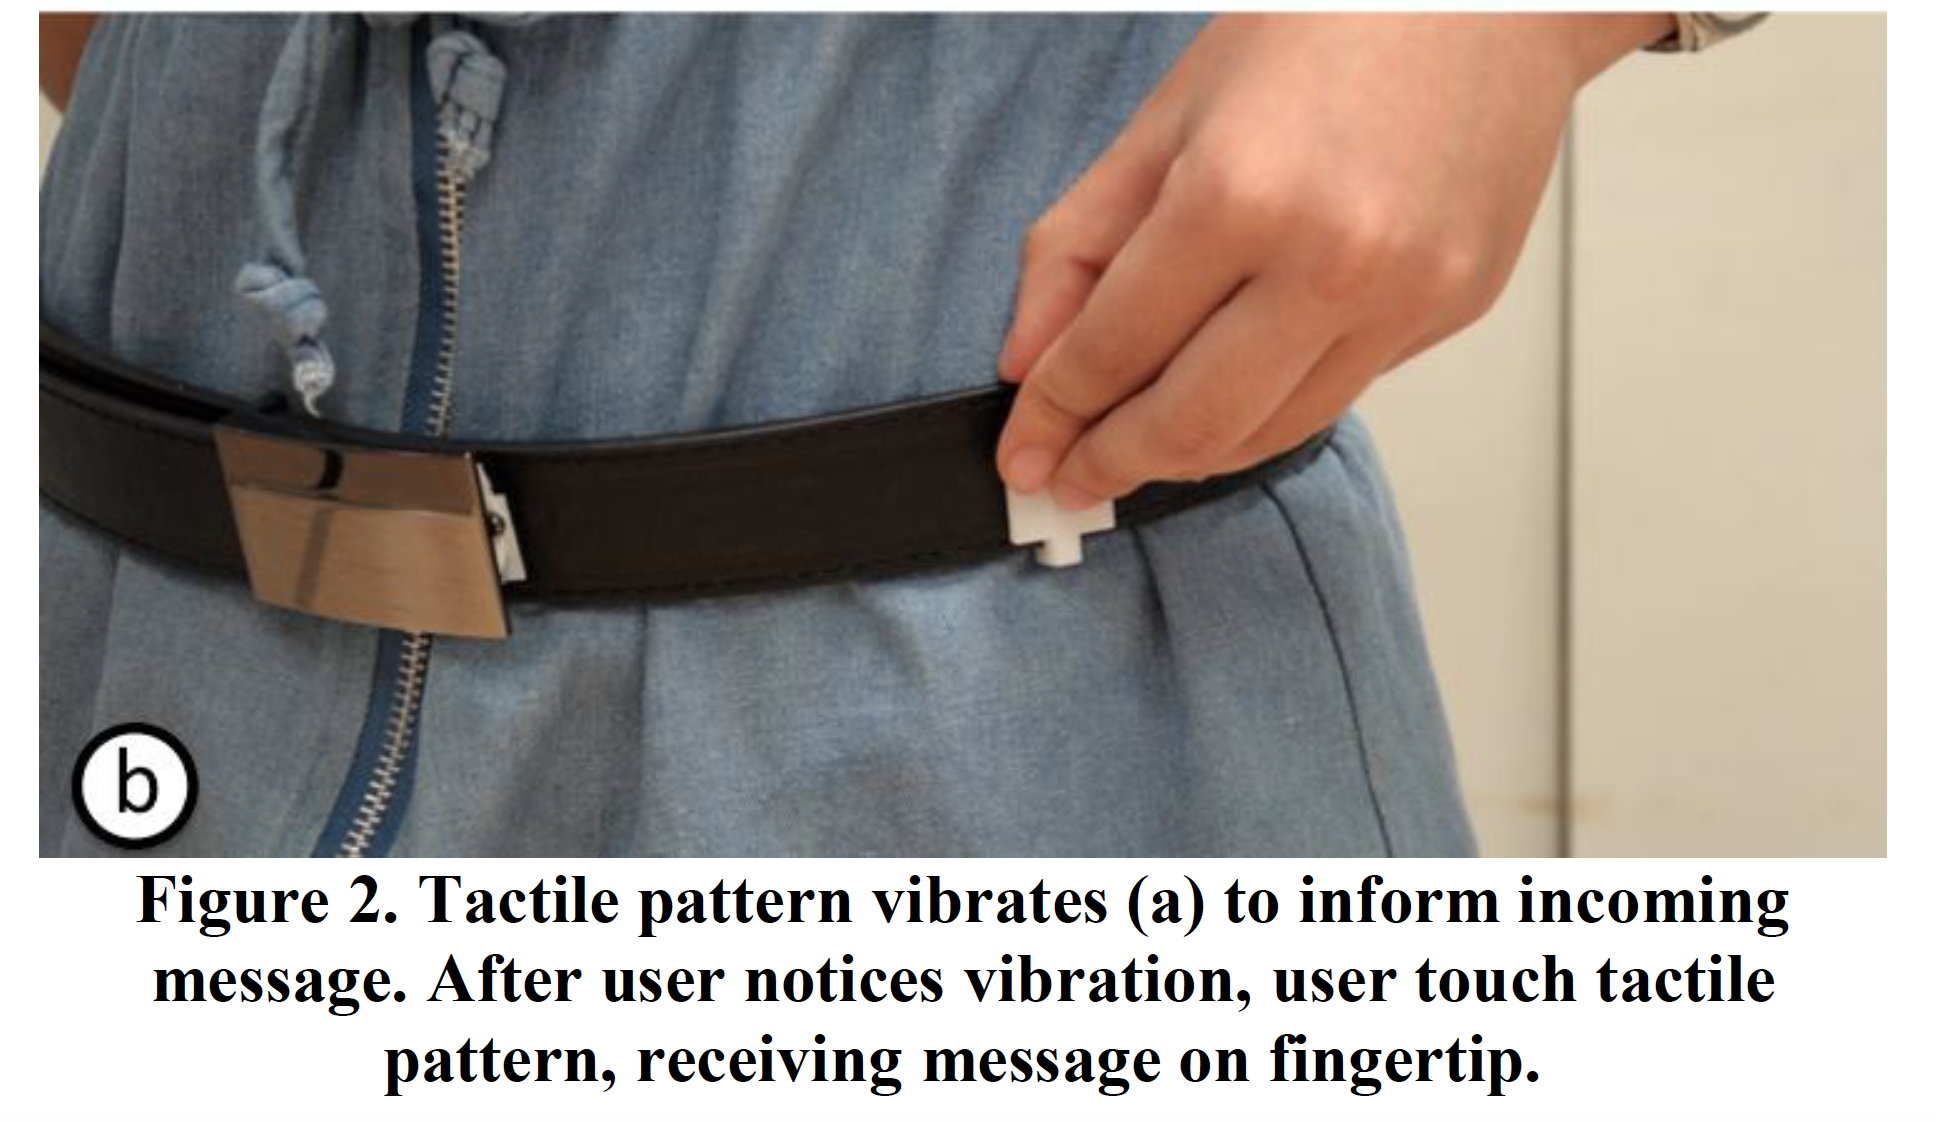
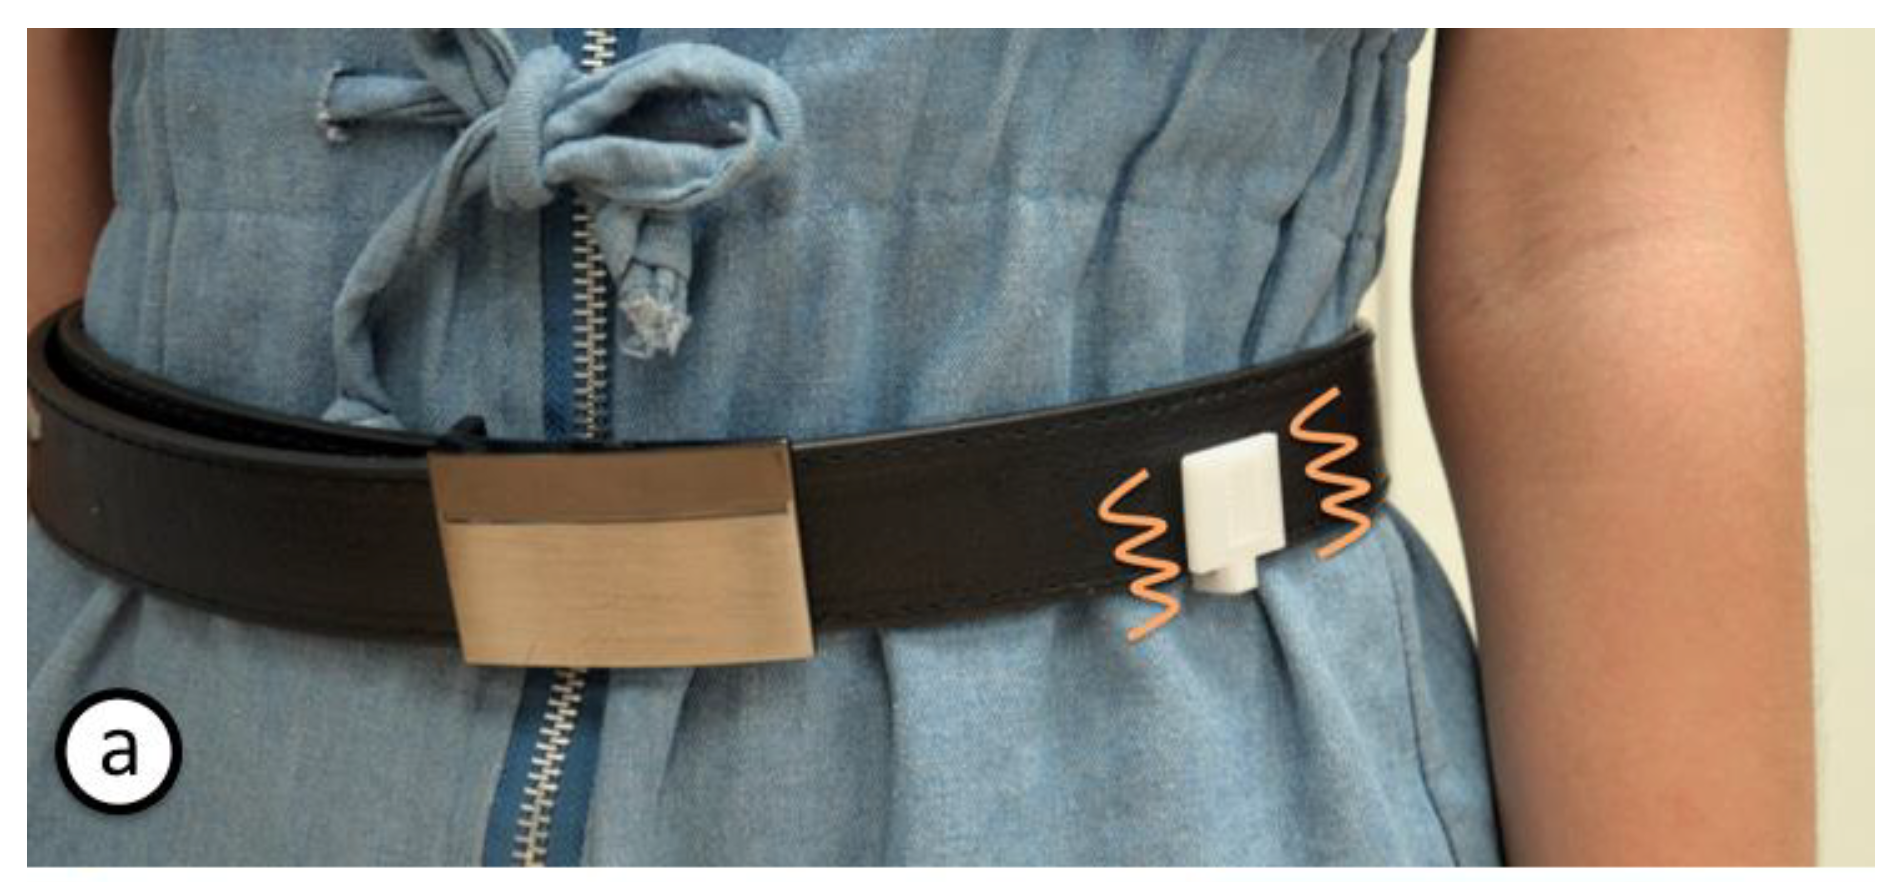
We propose NotiBelt, i.e., a tactile display that mounted on the belt for users to touch and receive messages. As Figure 2, a message is transmitted via two steps, (1) short vibration and (2) generating tactile patterns. After sensing vibration, users touch the vibrating area on belt and reading message on fingertips. The benefits of NotiBelt are (1) users determine receiving time by touching gesture which decreases distraction to undergoing conversation and (2) higher recognition rate for users to move their fingers around tactile patterns.
Electro-tactile Stimulation Patterns
USER STUDY 1
Before the study of touching classifier has begun, we have to figure out which position the belt can provide an acceptable service in touching classifier for users. Our study focuses on special occasions when people are socializing. This time our study is based on the occasion that people are talking with each other. We are wondering in which place users can receive information from belt more conveniently, and the conversation will not be interrupted frequently.
- Experimental Interface
In this experiment, eight parts are divided equally in the belt. In every part, there is a representative point in each direction (North, West, South, East, Northwest, Southwest, Northeast and Southeast). Each point‟s position is adjusted by users‟ waistline.
-
Task
The task of Study 1 is Position Survey. In this test, the occasions of users to chat with others are stimulated to build up a “real” situation. First, we help users to start to describe the environment details of their last conversations which they made and make them feel at ease in such a situation. And then, one of these points which represent one part of the belt start to vibrate randomly, and users need to touch where the belt vibrates without seeing the belt. Finally, the users will rank eight positions to judge whether this position is acceptable and convenient for him to touch the model and receive the message from it.
- Experimental Design
Participants provided feedback using structured-interviews with open-ended questions and 5-point Likert scales (from 1 – no agreement to 5 – strong agreement). During the test, eight areas of the belt will vibrate randomly, and we assumed that each area would vibrate three times. We recruited 3 participants between 18 and 30 years (m=2; 1 female), whose dominant hands are all right hands. Also, all of the participants are familiar with keyboard typing, and get used to wearing the embedded IoT system attached to belt. This part of study takes place in a lab environment, and users need to imagine themselves staying in Cafe, or some other relaxing place.
- Result
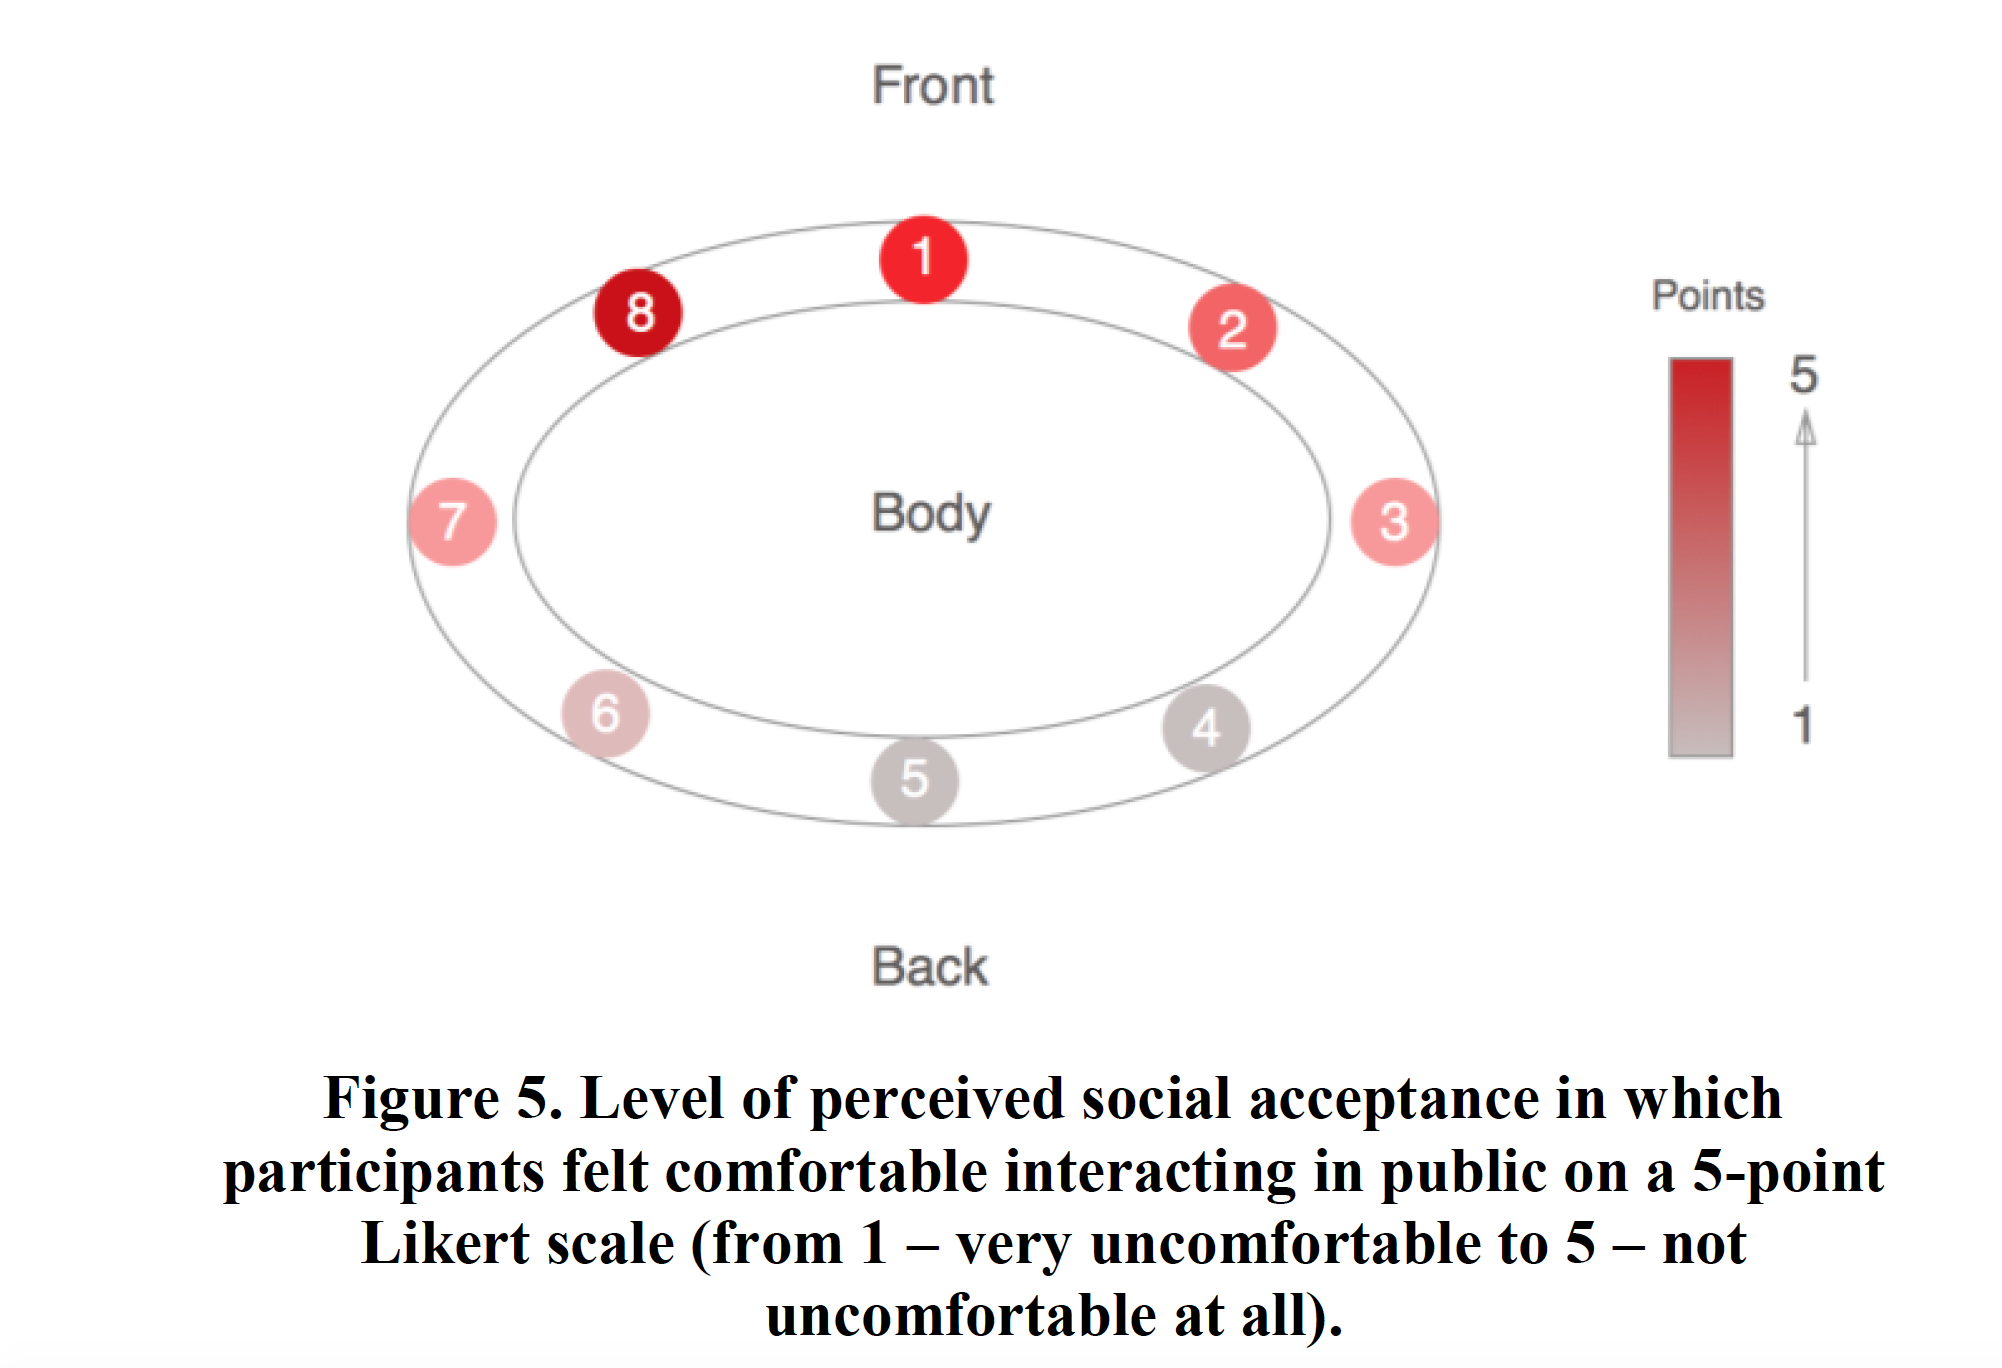
From the study, we have found that the front area (Position 8) has the highest grade (5) in all positions, which means that users preferred to touch the place in front of themselves than other places in the belt. Users believe that touching the area in front of bodies to receive messages is convenient, which will bring less trouble in social communications. In addition, the left-front area (Position 1) is the users‟ second favorite area, with the second highest grade (4.6) due to the hypothesis that the dominant hands of users are right hands, and in a social conversation, it seems reasonable for users to use non-dominant hands to touch belts instead of using dominant hands. The Position 5 and Position 6 gain the lowest grade in the ranking. We infer that the difficulty of touching for users leads to an inconvenient situation. The ranking result shows in Figure 5.
USER STUDY 2
After Study 1 (Position Survey), we have got that the best position (Position 8) for users to receive the feedback in the belt. So, we set Position 8 as the default position in this study and try to figure out whether users can use only one hand to touch alphabet models and classify all of them. We suppose that through a period of time in training, users will able to classify different alphabets, and in some certain models users can achieve a higher accuracy and speed rate.
- Experimental Interface
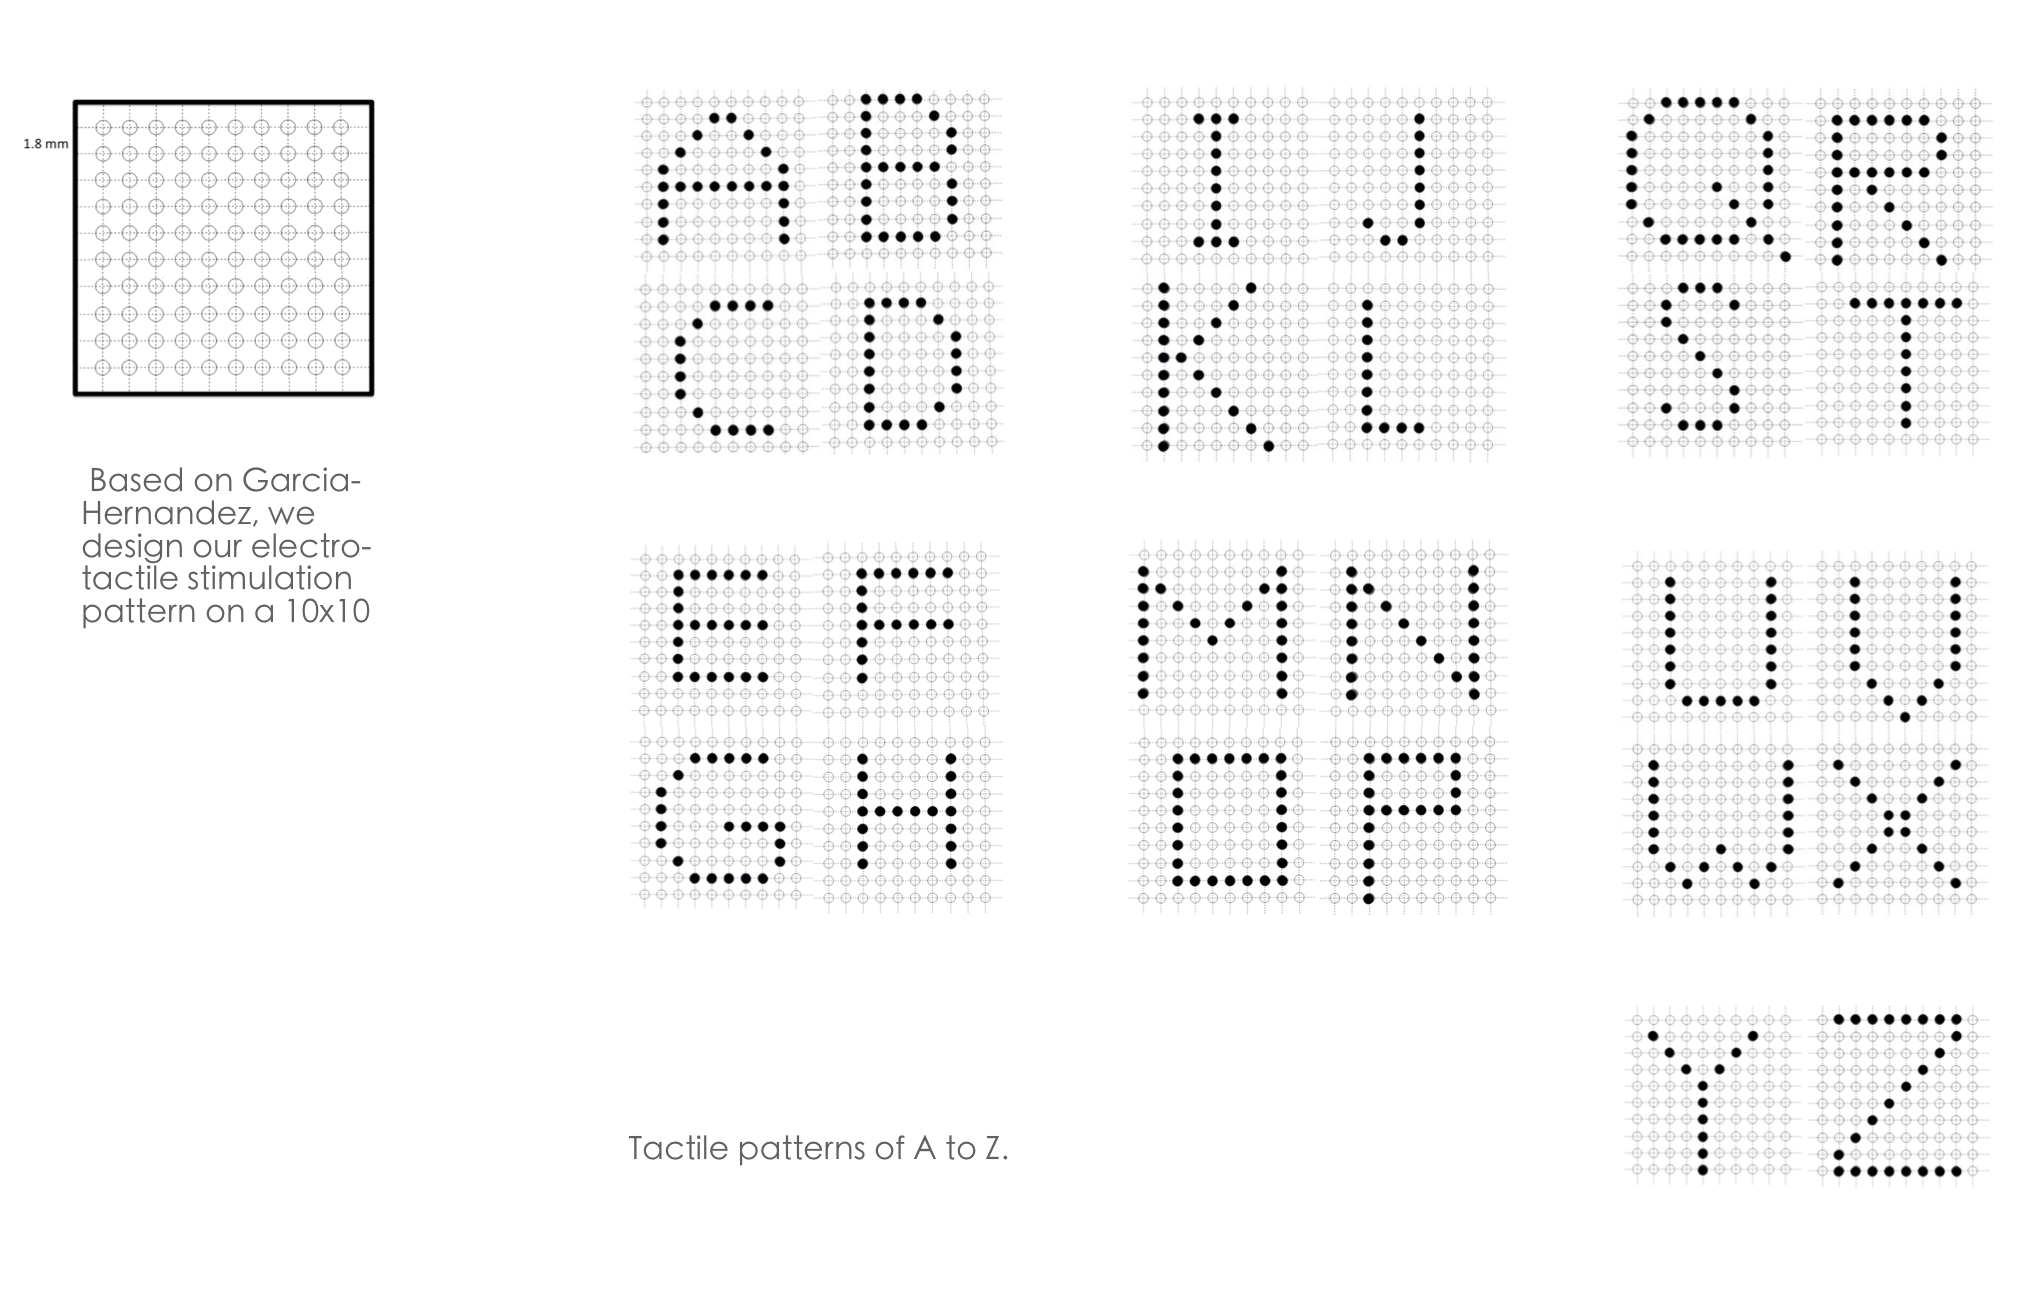
We use a 3D printer to make 26 models to present all alphabets. Each model presents one alphabet in 10×10 dot matrix, with the protruding and concave dot. A hook sticks behind the back of the model, which users can replace various models on belt commodiously. The details list below.
- Task
Through a period of time learning section, we suppose that users are educated to recognize the alphabet in the model by touching the model instead of seeing the belt. When the experiment starts, users need to touch the model by using their non-dominant hands as well as press the button of the timer to call by using their dominant hands at the same time. When users successfully finish recognizing the model, they release the button of the timer and the text model in the belt as well as answer which alphabet they have just touched. We will calculate the accuracy of users to classify models and the time users spent in touching different alphabet models.
- Experimental Design
A timer was designed in this experiment to calculate time consuming in touching different models. We provided users a random sequence of models to classify, and ensured that each model appears three times. We recruited 6 participants between 18 and 30 years (m=4; 2 females) whose dominant hands are all right hands, too. Comparing with the participants we mention above, participants in this part of study have the same characters as those.
- Result
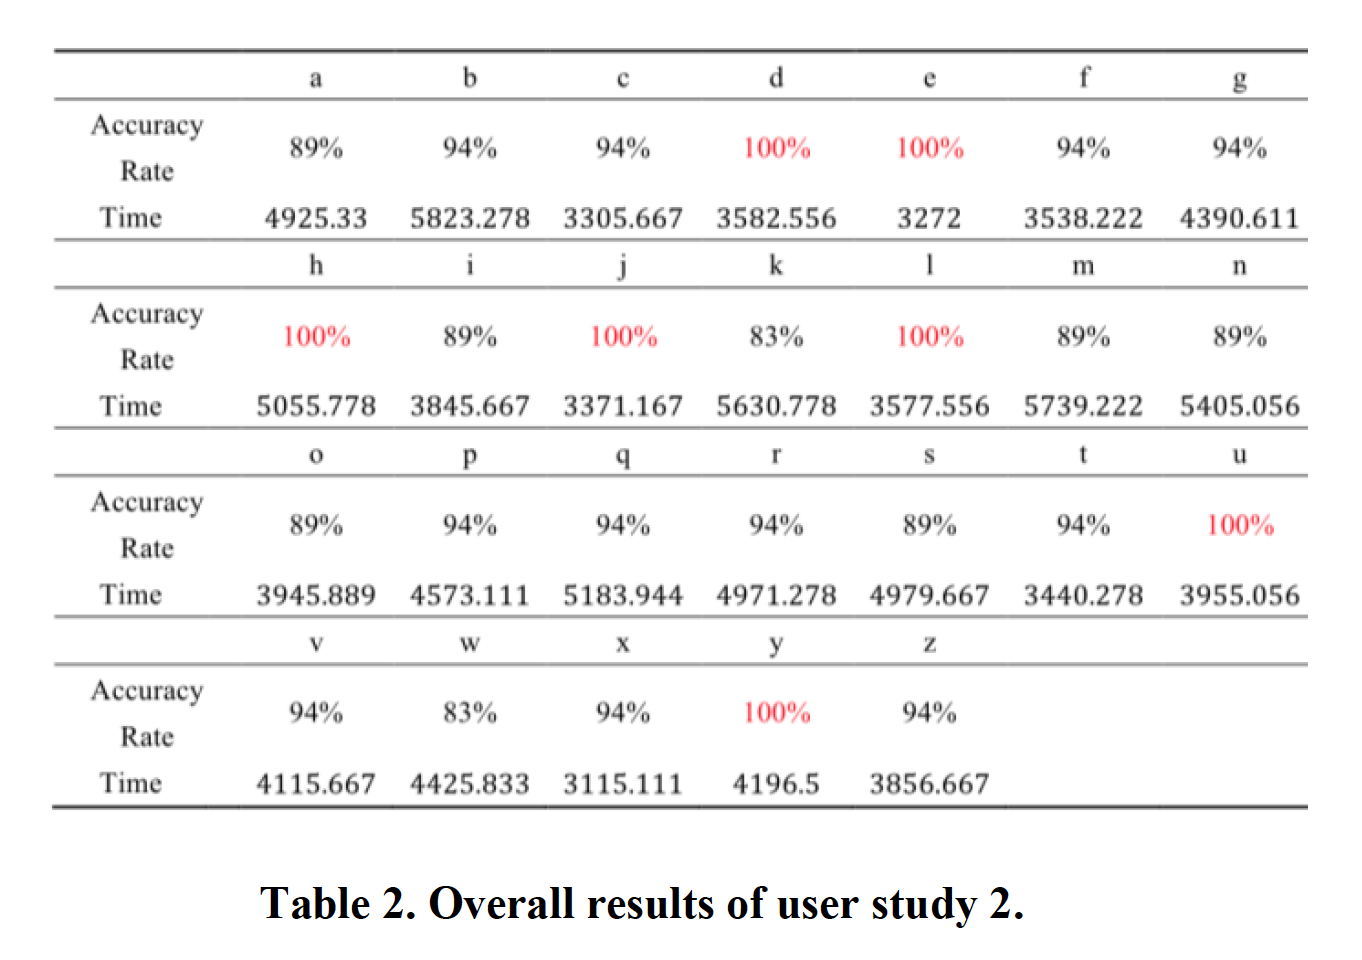
– Speed of Recognition
We use Analysis of means to calculate the mean value of speed rate of recognition, the highest value, and the lowest value. The results are shown in Figure 6 and 7.
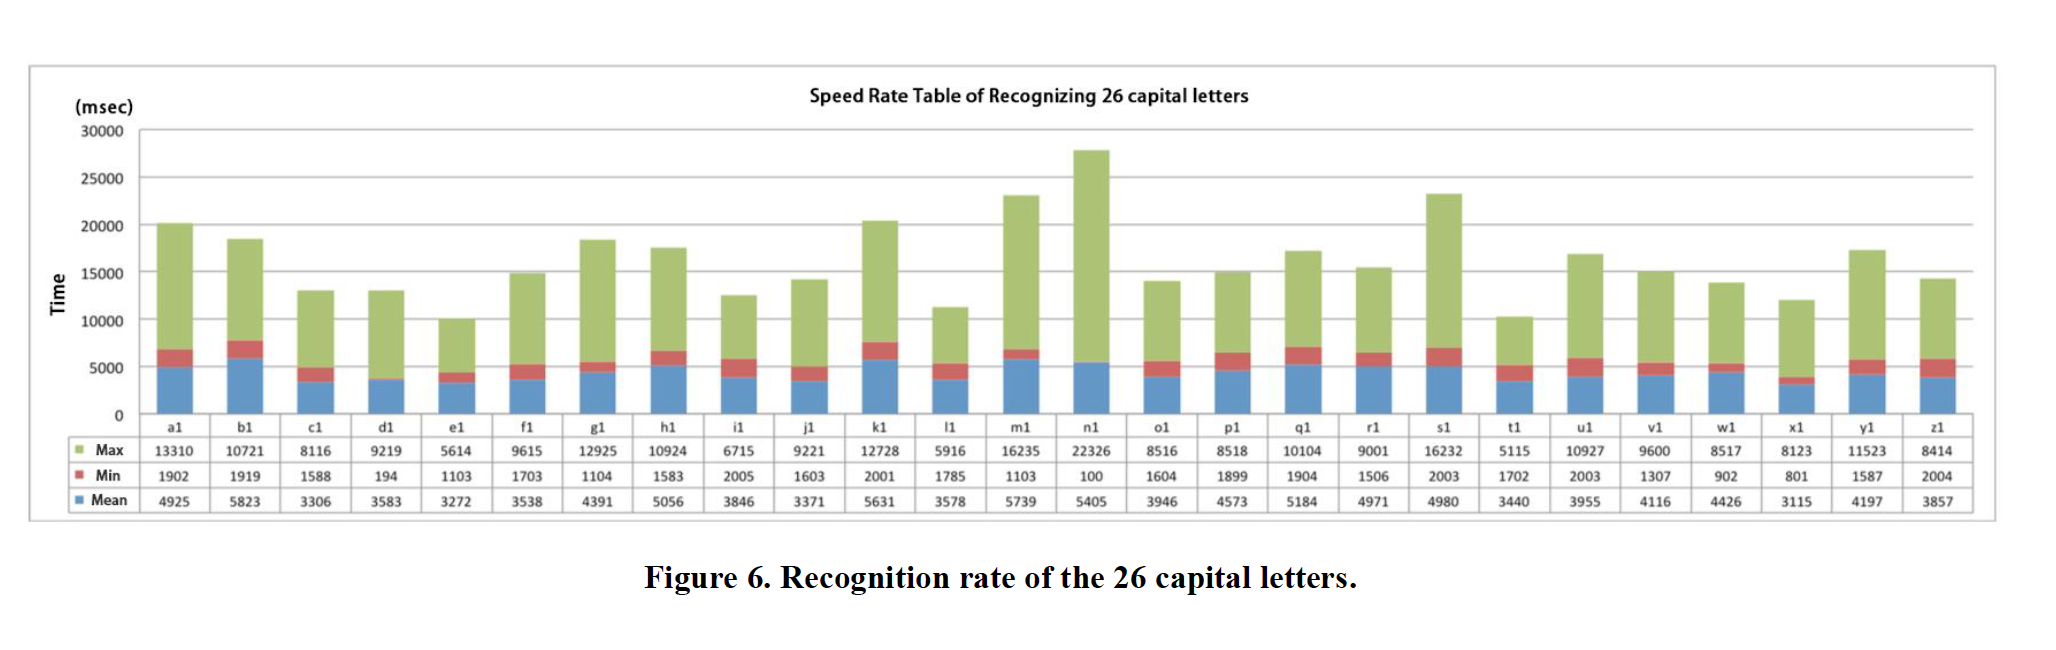
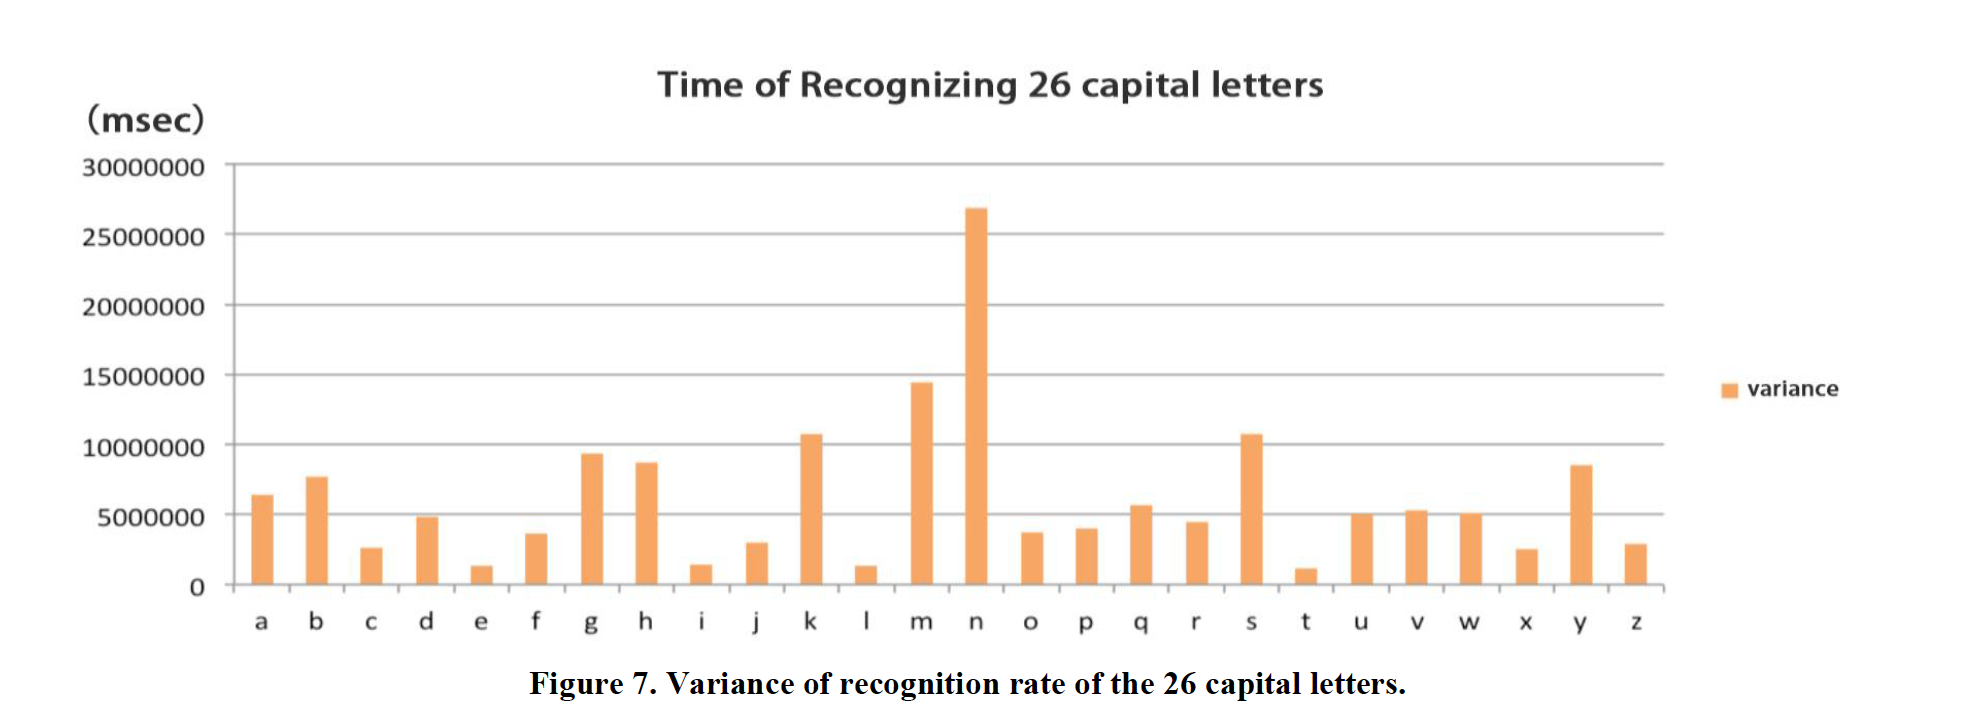
Comparing with mean values, we can conclude that recognizing alphabet X and alphabet E take far less time than other 24 alphabets. Recognizing X consumes the shortest time (3115 ms) than recognizing E (3272 ms). Besides, users spend more time in alphabet B (5823 ms) than others in the study. When considering the variance of speed rate of recognizing, the alphabet N values 2687 ms, which leads to the result that identification processes are extremely different for various users, especially for users with multiple academic backgrounds or their own habits of using electronic devices.
-Accuracy Rate of Recognition
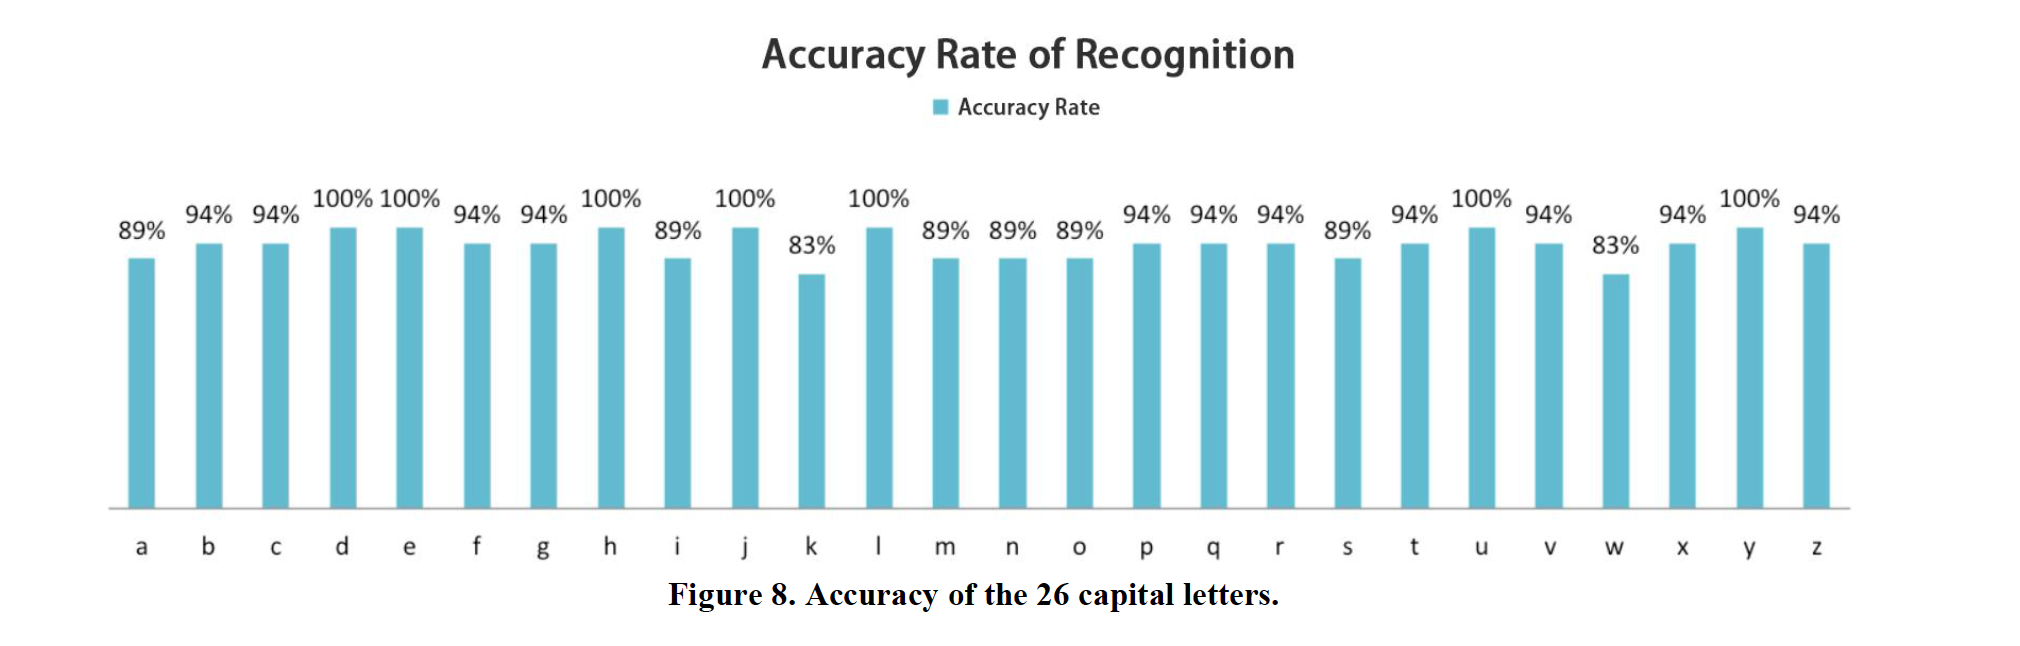
From the data we collected, the result presented in the table shows that users can recognize the following characters perfectly (100%): D, E, H, I, J, U and Y. However, the accuracy rate declines to 94% in the following characters: B, C, F, G, I, P, Q, R, T, V, X and Z, which means users make one time mistake in recognizing one of them. When classifying A, M, N, O and S, users make two time mistakes in each character in average, which leads the accuracy rate to 89%. In contrast, the accuracy rates of alphabet K and alphabet W are merely 83%, which is lower than others.
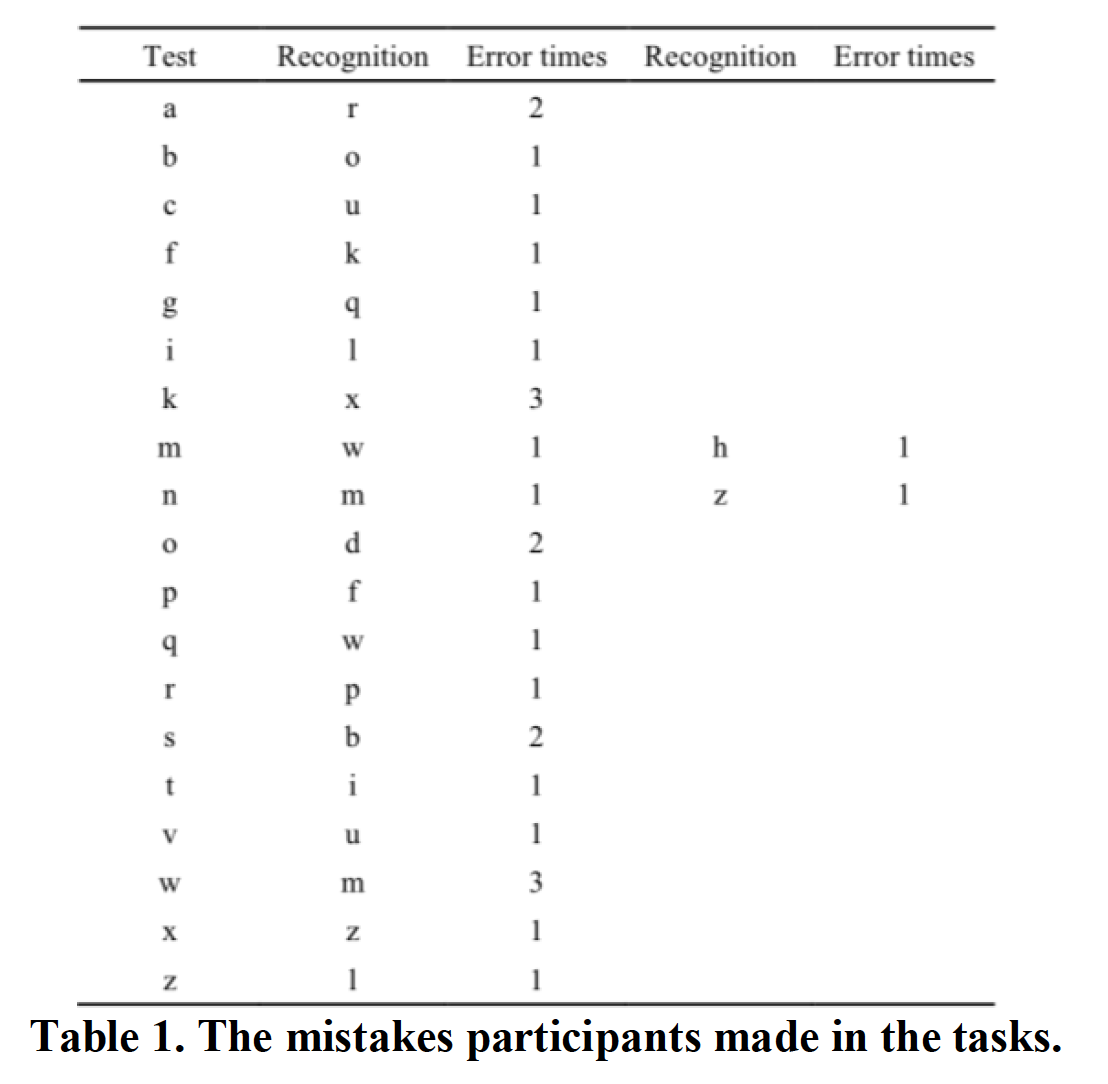
After observing the whole process of study, we found that users feel confused when classifying the alphabet K and the alphabet X due to their similar components. This situation also occurs in recognizing alphabet M and alphabet W. However, it‟s more frequent for users to mistake alphabet W for alphabet M than M for W.
Combined with speed rate and accuracy rate, the alphabet E is the easiest element for users to classify because users take merely 3272 ms to finish touching and recognize perfectly. On the contrast, users feel most difficult in classifying alphabet K due to its relatively low speed rate (5630 ms) and accuracy rate (83%).
DISCUSSION
Through these studies we found that the users can basically identify each capital letters in a short period of time (average time 4316.22 ms with average accurate rate 92% ) . That means users can get a certain amount of information through touching. We also found that E, J, L, U, Z are better letters for users to recognize, for their average time under 4000 ms with the accuracy of 100%. We assume that it because they are simple (no closed strokes) and have distinct characteristics (more horizontal stripes). This result may conduct us to design more suitable patterns for users to recognize through touching. So in the future, we will study more about the reason why one pattern‟s recognition time and accuracy differs from others.